Sign in to aurora+
Are you an existing aurora+ customer? Sign in here to check your balance, see your daily usage and top up.
Are you an existing aurora+ customer? Sign in here to check your balance, see your daily usage and top up.
Use our free online account management tools and forms to manage your account quickly and easily.
Find out how your household's daily electricity usage compares to the average Tasmanian's.*
Electricity bills – it's the topic of hushed whispers at family gatherings and curious conversations among friends. But let's be real, comparing your energy usage to others is like comparing apples to oranges, or fish tanks to flatshares. So, if your mum's house is lit up like a disco with five fish tanks and a jacuzzi, don't sweat it; you're not competing in the 'Who Can Consume the Most Power' Olympics.
Oranges for Oranges
While dollar values on your bill might not tell the whole story, finding out whether you're more of a power paladin or a conserving champion based on your household size is the real game-changer. With this knowledge, you can know if more savings can be made! Plus, who doesn't love graphs and numbers to show you the ebb and flow of your energy consumption throughout the year?
Seasonality
Sure, we all know that winter's chill leads to a spike in energy use as heaters and electric blankets come to the rescue of freezing toes. But what about those sneaky shoulder seasons – Autumn and Spring – that also play their part in our energy tango?
What we're comparing
We've gathered together electricity data based on Tasmanian daily averages from Make Energy Easy*, which is a great site for power facts, and made some pretty ways to visualise the info.
Got your bill in hand? Great! Now let's dive into deciphering your electricity usage.
Locate your average daily energy usage on your trusty Aurora Energy electricity bill.
Consider which season this bill covers – is it your winter electricity bill or your sunny summer one?
With that in mind, cast your eyes on the graphs below – they'll tell you if you're a power-hungry champ or a laid-back energy guru.
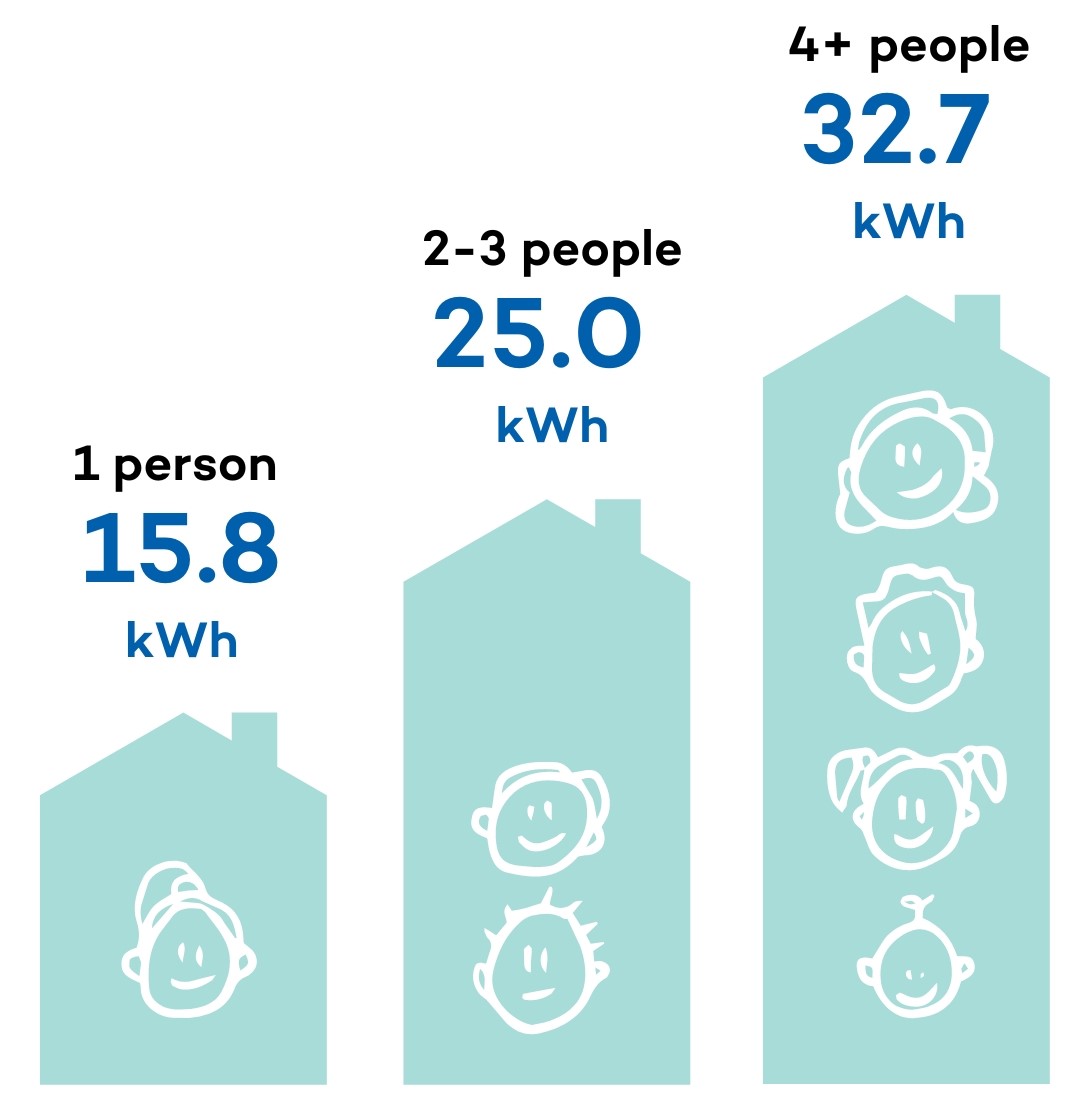
From balmy days to crisp nights, Spring brings a mix of weather that keeps both fans and heaters on standby.
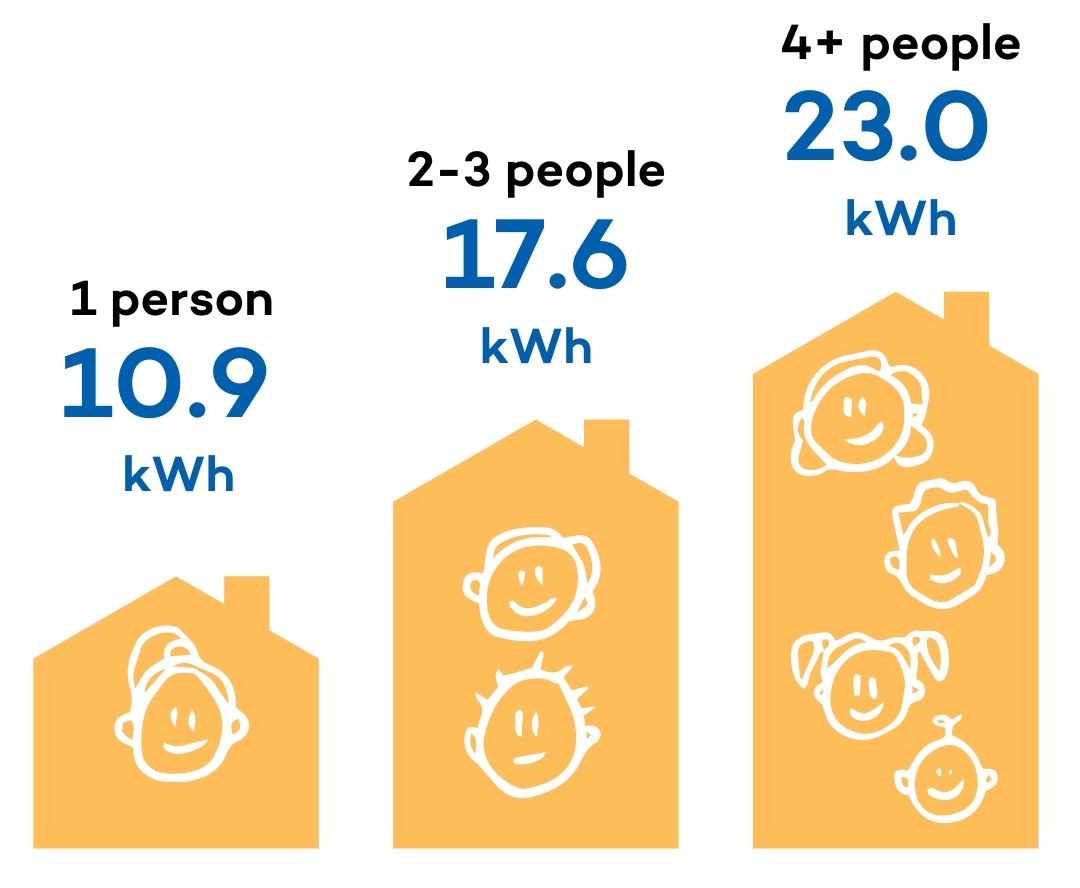
Summer sizzles with sunshine, cranking up air conditioners and fans as everyone seeks refuge from the heat.
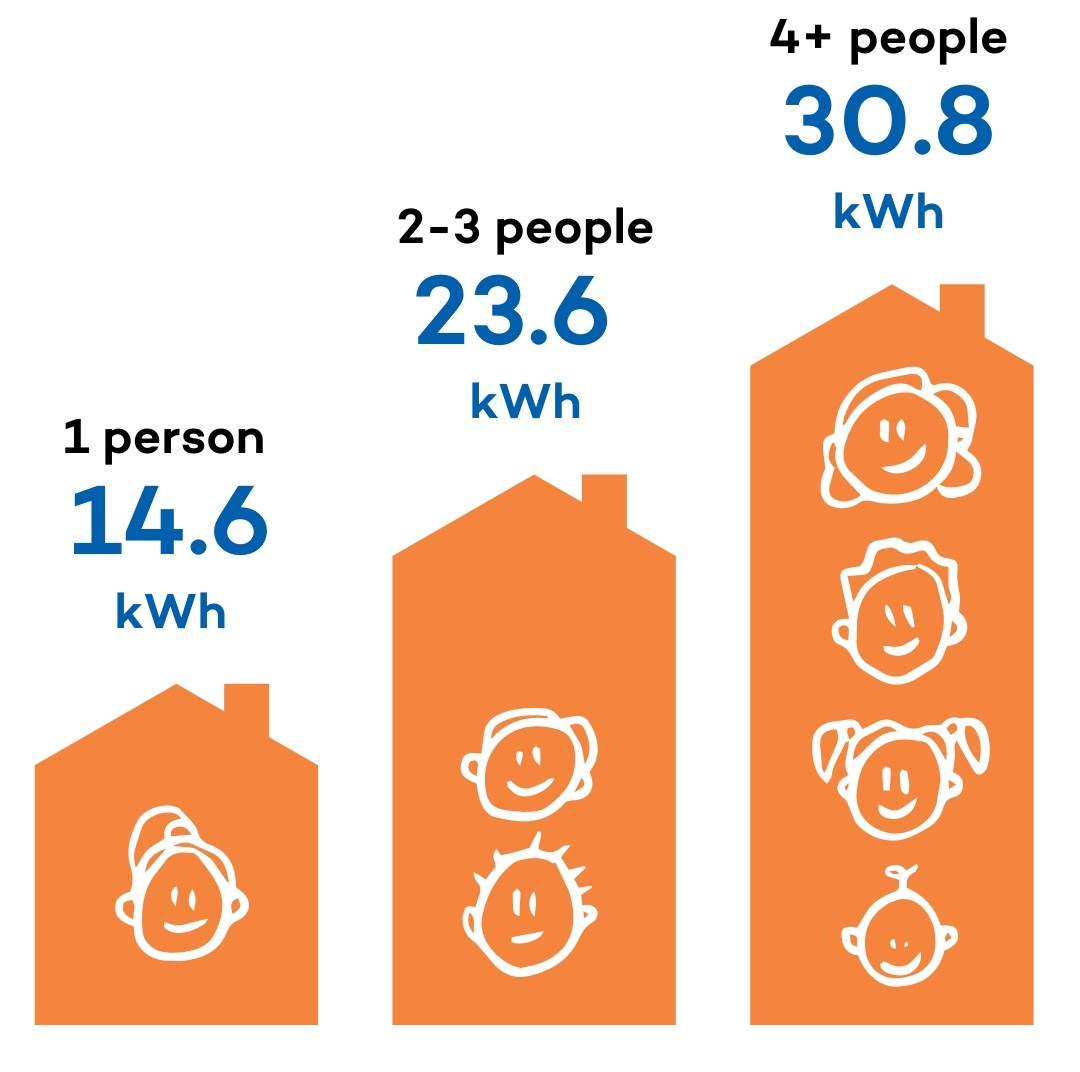
As leaves turn and temperatures dip, Autumn invites cozy evenings, a time for heaters and warm cups of hot choccy.
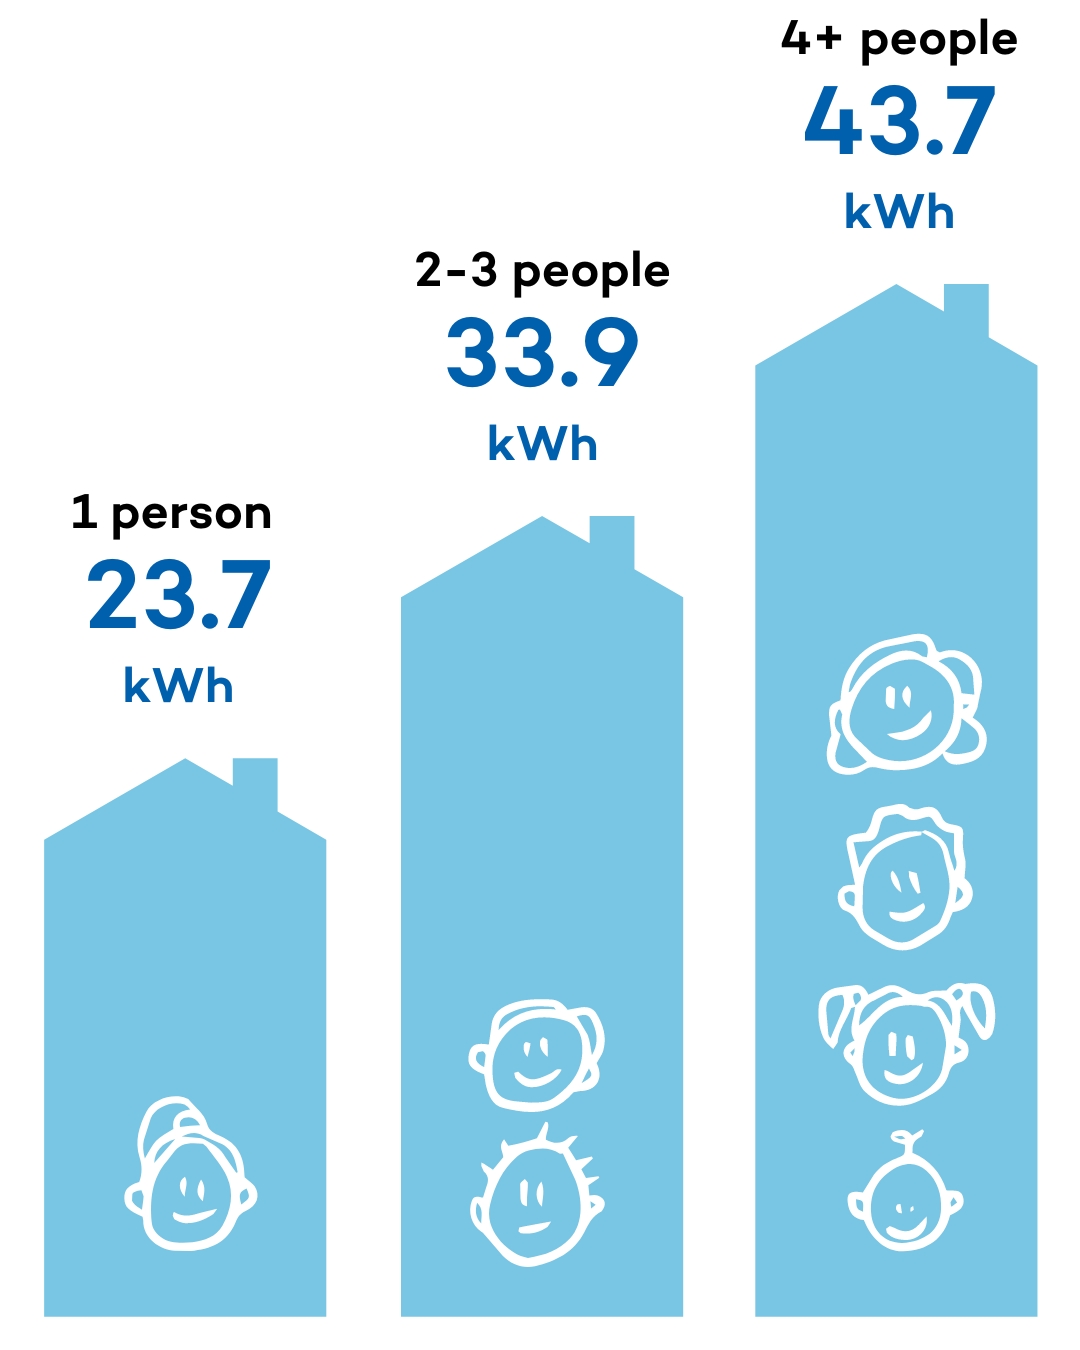
Winter's chill takes centre stage, prompting everyone to snuggle up and power up those trusty heaters.
If you find yourself towering above the average Tasmanian household consumption for your size, don't worry; we've got tips to help you trim those energy-eating habits and conquer your next bill with gusto.
On the flip side, if you're sipping electricity like it's your morning cup of joe and your bill reveals you're using less than the average Tasmanian household of your size, well, get ready to bust out your energy-saving superhero cape.
But remember, we're all unique. If your electricity consumption rivals that of a four-person household in Tasmania, but it's just you and your feline friend, it's time to channel your inner Sherlock and solve this electrifying mystery.
For more clues and tips, head to our website's energy-saving zone
Energy Made Easy
Table of Data
Collected from (https://www.energymadeeasy.gov.au/benchmark) on 25 May 2023 which represents electricity data for a localised zone of postcode 7010. These estimates are based on an average household in this location, with electric heating and electric hot water heating. Individual usage will vary. For more information, see How does your energy usage compare?
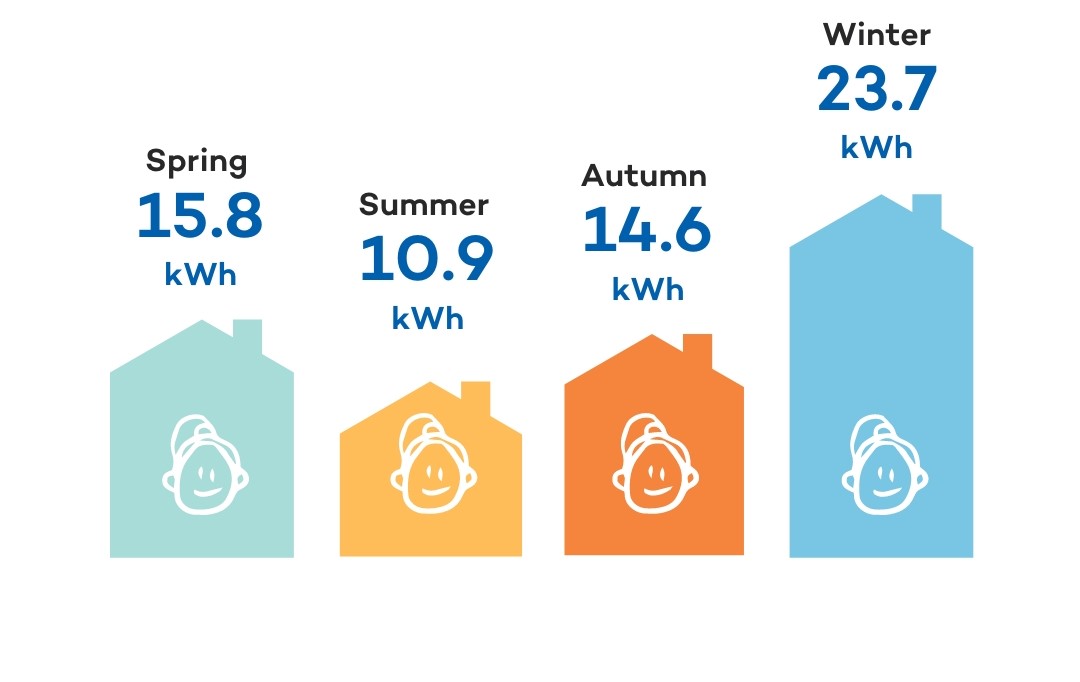
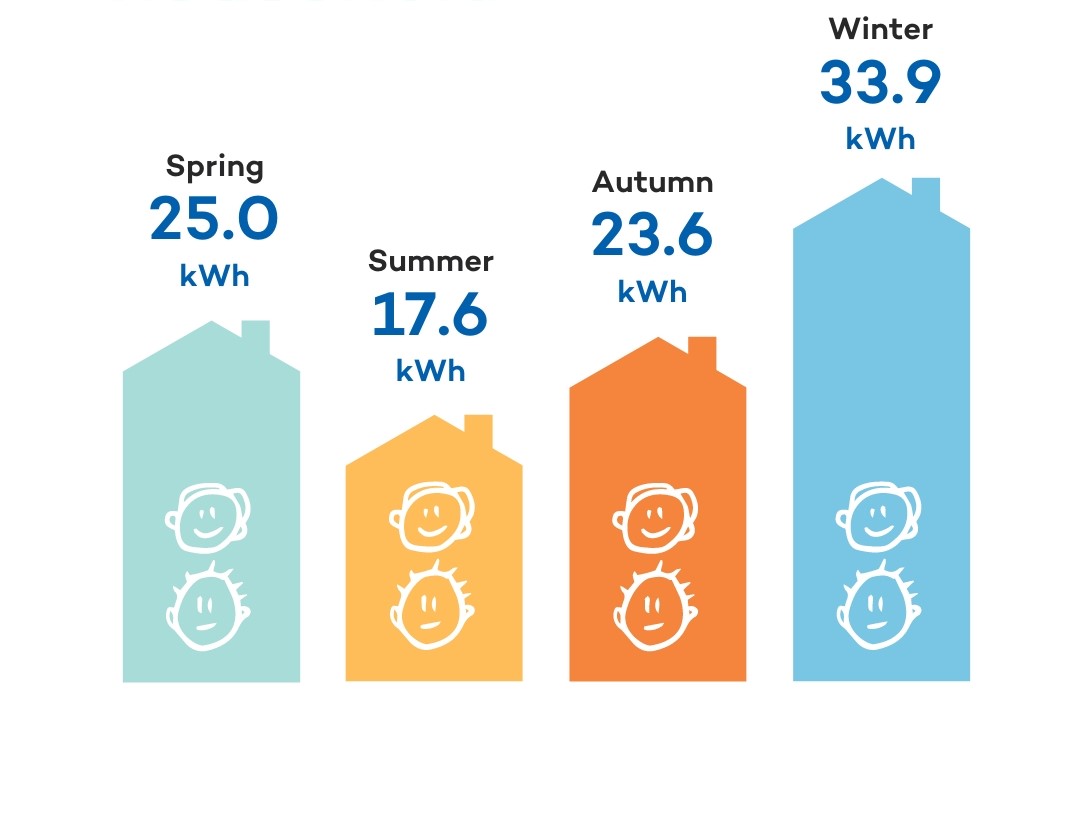
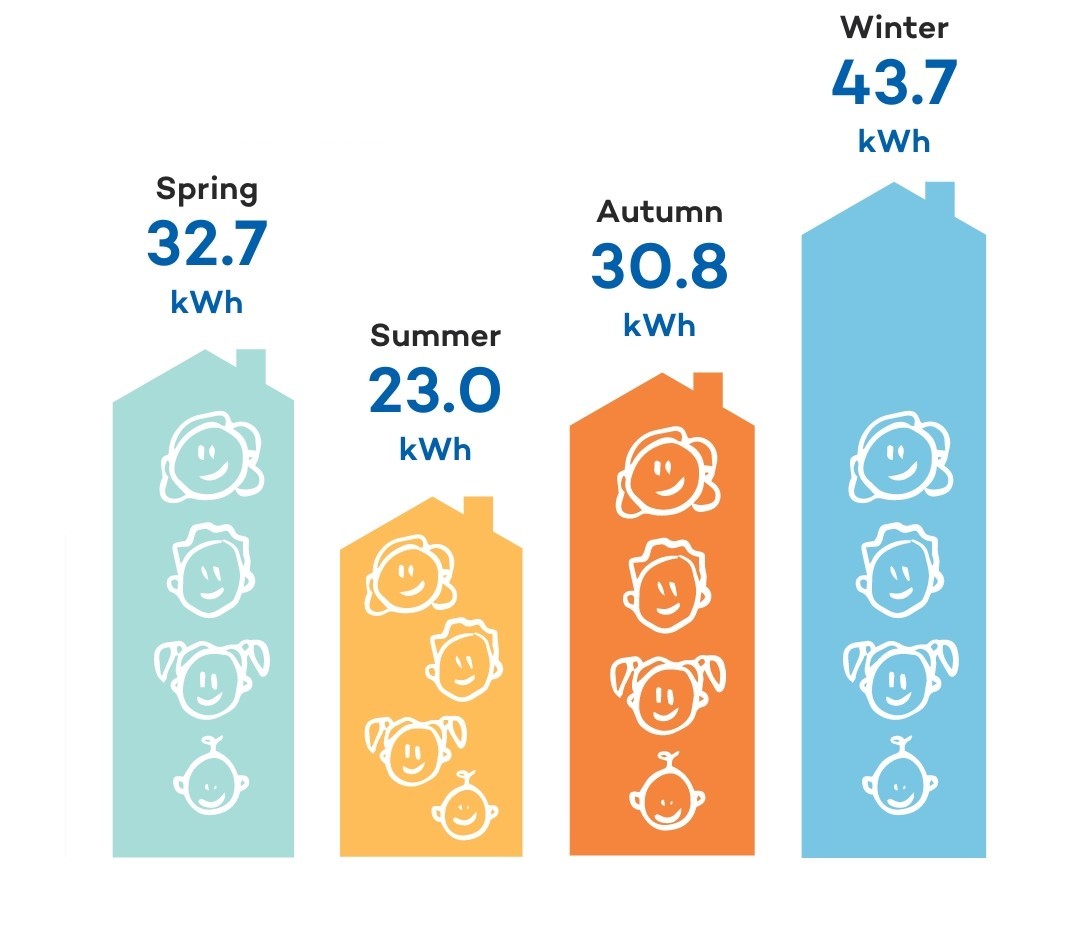
| Tasmanian Daily Averages / kWh | 1 | 2-3 | 4+ |
|---|---|---|---|
| Spring | 15.8 | 25.0 | 32.7 |
| Summer | 10.9 | 17.6 | 23.0 |
| Autumn | 14.6 | 23.6 | 30.8 |
| Winter | 23.7 | 33.9 | 43.7 |