Sign in to aurora+
Are you an existing aurora+ customer? Sign in here to check your balance, see your daily usage and top up.
Are you an existing aurora+ customer? Sign in here to check your balance, see your daily usage and top up.
Use our free online account management tools and forms to manage your account quickly and easily.
There is a graph on your bill to show you how much electricity you’ve actually used in the quarter and how that compares to the average used by other households in Tasmania. This is based on the season, how many people are living in the house, and how many days there are in the billing period.
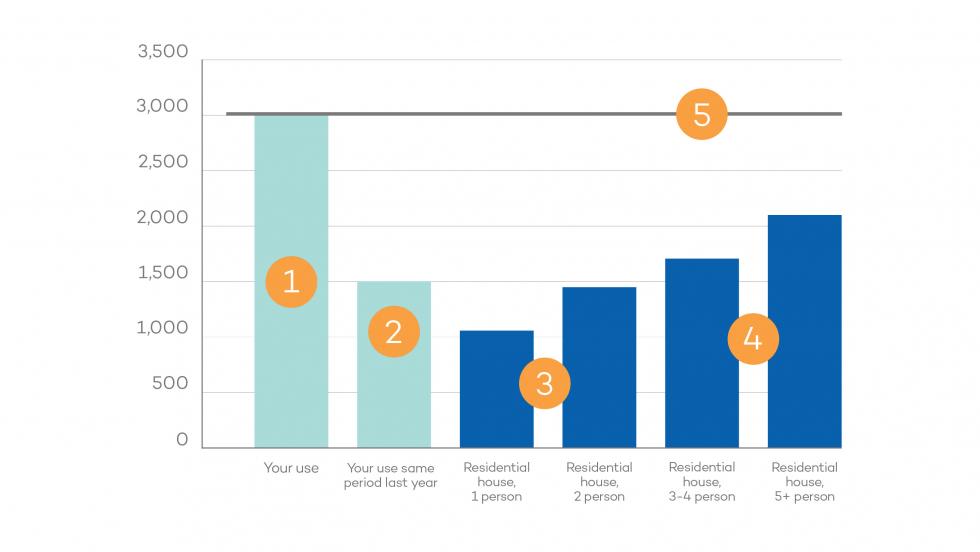
The type of house, heating, extra guests, appliances, faulty equipment and renovations can affect your electricity use. (If you would like help reducing your use, take a look at our energy saving advice)
If it looks like you use more electricity than the average household, it may be because:
Remember the graph is a guide only and based on averages, while yours is actual use. If you are still worried that your energy use seems higher but you don't know why, you can call to speak to our team between Monday to Friday (8am-6pm) on 1300 132 003 and we'll see if we can help you find out why!
The comparisons are based on season:
There are a couple of reasons why the usage comparison graph and the average daily cost on the back page of your bill may not be accurate when you have solar.
The usage comparison graph compares the total amount of kWhs used in your home in the billing period, to the same time last year (if possible) as well as the average usage of other Tasmanian households.
Because we do not have access to the amount of solar you generate and use yourself, this cannot be added to the total of kWh used in your household.
As well, your exported solar energy (the solar you don’t use yourself and feed into the grid) is added to the total of your kWh used.
We are aware that this is not ideal and apologise for any inconvenience.
Putting the graph on your bill is a regulatory requirement under the National Electricity Retail Law.
For more information about the graphs and energy use in Tasmania, visit the Energy Made Easy website (external link).
We get it, bills can be complicated. If you still need a bit of guidance understanding your bill, our team is ready to help!